Pages

Saturday 14 December 2013

My trades of 2014

2014 should see the occurrence of tapering (if not next week) and as such we will likely see rising rates going through next year, and as such we should see a rising USD on the back of it.


As we can see the relationship is clearly very strong and with rates only heading higher through 2014 broad USD strength is likely to come about.

As such the basis around my trades for the year are USD bullish and bearish bonds


1st trade: Short EURUSD via 6M 1.3750 put, entered at 7.6%

The timing around my USD bullishness is the hardest thing at the moment, while I'm sure we do eventually rise, it's just when, that is why I'm entered into a longer dated put in the EURUSD

Firstly, with Volatility so low in the FX world, the cost of the trade is quite cheap, and as such if we see a pick-up in IV the option value should benefit.

Furthermore, the premium payed on the trade is 290 pips and a strike of 1.3750, therefore the B/E on the trade is 1.3750 - 290 pips = 1.3460.

Ideally my targets on this trade are for the EUR to be below 1.30 in 6mo

2nd trade: Long USDCHF at market (0.8875) stop under 0.85 and a target of 0.9750

The CHF has the most to lose from the major currencies, and as I expect EURCHF to rise to 1.25/27 by year end 2014, the USDCHF should do very well with broad USD strength.


He we can see the last couple of years in USDCHF and horizontal lines represent the exit levels.

3rd Trade: Long USDSEK at market (6.57) stop under 6.25 and a target of 7

Broadly the same idea as the previous two, but with weak inflation in Sweden, it is likely that the Riksbank stays very accommodative and potentially cuts rates, so on top of USD strength, the SEK could be very weak too.


4th Trade: Short US 5's, stop under 1%, looking for a move to over 2%

This trade was entered on the 27th of Nov when the US 5's where at 1.35%, and broadly speaking with tapering, the 5's should rise substantially, to at least their previous highs. Entered via futures.


This is all being played off the idea that Monetary Policy is likely to diverge through out 2014 as shown below


Friday 13 December 2013

DecTaper and Implied Vols

Next Wednesday we've got the final FOMC meeting of the year where it will be revealed whether or not the Fed has decided to taper its $85bn/month asset purchases.

As it stands, We've had pretty decent payrolls (last 2 month >200k) and a headline U/E rate hit 7% yet very few predict a DecTaper, consensus is for March '14

*Reuters poll on when will the fed announce Tapering

Gold has had a huge offer capping its advance the last week, and likewise in the USTs where the 5's have risen 20bps since I shorted (here), the price action is surely worrying for those expecting no taper.

Furthermore, if we look at the options markets there has been some interesting moves in Implied Vol as we've rolled into the FOMC meeting on the Spot Week contracts


As the contract rolled into encompassing the FOMC meeting yesterday, we saw a large spike in IV, while this is to be expected the move in SW EUR IV as shown above was the largest 1-day % change on a YTD basis, much larger than the September meeting spike and the NFP for Nov.


 Here we have USDJPY IV for the Spot week ATM contracts, where the Spike in IV, while well below the actual IV level, was the  joint highest on a YTD basis. This equalled the moved seen pre September meeting where the USDJPY moved >1,25% on the day. So as it stands, that seems to be a decent benchmark to go off, when deciding the markets sentiment going into next week.


Finally we have the AUD SW ATM IV where we can see the move has been by far the largest so far YTD, and considering the move post Sep FOMC meeting was a swift 1.73% rally, we can see that the market is preparing itself well in advance for some large vol moves. In this instance, the actual IV level is greater than in September, so we can definitely see the options markets are getting concerned about some surprises.


Finally a 3D surface view, we can see the inversion in the term structure quite clearly and this follows out until about 2-3 months, however the Risk reversal skew on the SW is relatively small, therefore suggesting the cost of either a put or a call is somewhat similar showing that there is currently no noticeable bias to market sentiment, if the Put IV > Call IV by more than 2 points then there would be some serious worries but it is not so bad currently.

However, according to Soc Gen traders

"1wk usdmxn paid at 15.5, it's 15/16.5 now.  1wk usdbrl paid at 15.25 and then 15.5, it's 15.2/15.8 now.  Rest of the curves are around 0.3-0.4 higher on the day too now

While its not an EM proper AUDUSD also getting lifted - 1m rallied from 9.7 to 10.1 paid and all requests that we are seeing in aud related pairs are buyers"

So we can see that the AUD is being used as a proxy for EM exposure due to its greater liquidity and similar PA characteristics, and all trades being buyers of options suggests that there is a real concern about the volatility that could ensue next week. (remember IV~= the cost of the option).

And from CitiFX

"FOMC event risk priced in the short dates is not fading at all. USD gamma is getting more and more expensive as we approach the event."


We should consider that USDJPY options tend to be the highest volume and most liquid as shown here from DTCC data


All in all, we can't quite yet gauge a proper look at the option expected impact of the FOMC, until the contracts roll into ON and we can look at premiums and costs of ATM straddles etc, but as it stands now, the early protection via options has broadly been largest this year and as such we need to be very careful going into next week.

GL

Wednesday 27 November 2013

Top trades of 2014

So, over the last few days, we've seen various sell-side institutions come out with top trades of 2014 so lets have a look

Goldman Sachs

#1 Long S&P, funded by short AUD executing in the December 2014 futures contract at 1986.8, targeting 2250 (+13%) and stop below 1855 (-6%)

Rationale for this is as followed "Long the S&P 500: “Earn the DM risk premium, Offset by a short AUD position: “…Hedge the risk “"


#2 Long 5-year EONIA swap vs. short US 5's at -61bp, looking for a move to -130bps 

This is because "Growth Differential Widens and Service Price Inflation Diverges, also Forward Guidance is in the Price"

Broadly speaking, they are placing a trade on the expectations that the Fed are moving towards tightening while the ECB are doing the opposite.


#3 Long USDCAD at market (at the time was 1.0550) looking for 1.14 in 12 months


·         Canada’s current account position has been in deficit for some time
·         Slowing reserve diversification into the CAD has recently pushed the BBoP into deficit
·         The BoC is also concerned about weakness in the export sector and low inflation
·         Domestic demand may no longer receive a boost from the housing market
·         The BoC is one of the few central banks with scope to cut rates
·         US growth and tapering may move interest rate differentials further against the CAD
·         In particular, a sell-off in the US front end could significantly accelerate a $/CAD rally

·         We forecast $/CAD at 1.14 in 12 months' time


As of writing, these are all the released trades from GS, but more are expected throughout the week

Now onto,

Bank Of America


#1 Short US 10y at 2.78% looking for 3.5%


#2 Buy GBPCHF via call fly


#3 Buy MXNJPY


#4 Short EURGBP via 6M digital puts


The entire research note can be found here

https://www.dropbox.com/s/4i68iaapamjkhmz/BoA%2520Top%2520Rates%2520and%2520FX%2520Trades%2520for%25202014%5B1%5D.pdf

Thanks

Taper Trades

Depending on where you read, the chance of Taper centres around early 2014. However the various asset classes show a very different, individual picture.
By looking broadly at the major few asset classes we can see how to best position for the "inevitable" Taper. Throughout this we need to remember that going into the Sept 18th the market was positioned such that Tapering was expected - the market was surprised, but we can use those values as a benchmark to compare to now.
Firstly, Gold (GLD) -
The precious metal has been incredibly weak (spot ref, 1242) recently, down 10% since the Sep 18 no taper FOMC announcement, roughly the same loss since the first major mention in June.
Gold price, daily / thomson reuters
The fact that the gold price has been so depressed shows that, at least commodity traders, fear that tapering could be very soon. In fact the delay in Sept. hasn't changed much and we will still head much lower.
US Treasuries, (TLT/IEF) -
However, UST yields, which would broadly do the inverse of gold regarding tapering are currently 13 bps lower than Sept 18. This to me suggests that the Fixed income markets see Tapering being less likely and the direct buying of USTs and MBS from the Fed has pushedyields lower. In fact for not one instance has the US 10 year yield traded at a level seen at the Sept 18th FOMC meeting.
US 10yr yield, daily / Thomson Reuters
However the Belly of the curve - the US 5s have dropped in yield far more than the 10's. This is because the 10s price in a guaranteed tightening cycle where as the current 5s may just be on the edge and as such the yield has dropped much more since (I'll touch on this more later)
The USD, (UUP) -
Of course, after the QE program was continued in September the USD reacted poorly. But since has recovered nearly all the loses since then and is trading at around 80.64 on the Dollar index (DXY). We must remember the weighting of the constituents for the DXY as the EUR is over 50% and we saw a rate cut there, and the JPY has had further BoJ intervention (talking mainly). So we can judge that the USD as a whole is broadly a touch weaker since the FOMC, roughly to the same extent as the bond markets. US dollar Index, daily / Thomson Reuters
When we consider these 3 asset classes combined, the so called FICC (Fixed income, currencies and commodities) we see that when we scale the chart to the Sept 18th FOMC day there is a large variance in performance as shown below
Overlayed asset classes, hourly since Sept FOMC / Thomson Reuters
So, How I interpret this is as followed:
Gold is lower (on the chart it is inverted and green) since Sep 18th suggesting that Tapering is just around the corner, and as such a strong NFP will result in a December Taper.
US Dollar index is barely changed pricing in tapering, but not as much as gold - so suggests the consensus view of January 2014 for Tapering to start
US 5 years are much lower, suggesting the belly of the curve isn't buying into the taper idea any time soon and it has dropped off subsequently. This in my opinion would be pricing in a March or later Taper.
So the gameplan for me going forward is that to position into December and year end would be to Short US 5's, via futs, cash, etfs etc (just get long interest rates) and to simultaneously be long gold. This would mean that if there is a surprise and we see a December taper then the losses on Gold should be less than the gains on Short USTs because of relative values at the moment. If the opposite were to occur then Gold would rally significantly and USTs would only rally a bit (therefore a hedged, well risk-adjusted profit).
At this time, staying vigilant on the USD and being short USTs / Long gold would work well ( maybe long 1 GLD while short 2 TLT or something to this effect).
Thanks for reading, Good luck.
Jeremy.

Monday 11 November 2013

Some models

So following on from my last entry on "fair value" I would post a bunch of varying models for FX pairs. But a quote from Kit Juckes of Soc Gen

"In all FX models, the sensitivity of a pair to any factor changes over time. So people build models, then test them on a sample..."

In other words, the model works at showing the past perfectly, but needs to be constantly adapted for the future. Either way, I've got a few that work pretty well - most include Vol skews, equity perfomance etc and most importantly Rate differentials. R^2's are all above 80, and some even into the 90's suggesting great relationships here.

Most of my models relate to EURUSD but there are some for others and they show the deviation from Actual in a histogram in the second pane.

Firstly - A plain and simple YTD modelled DE2US2 rate implied EURUSD

Green = model. Reuters Eikon
The simplicity of this model can't be overlooked as short term rates are crucial in pricing FX, and as Schatz and US 2's are so liquid they are a perfect combo to consider.

_________________________________________________________________________________


Next - A medium term Swap fair value model, using 1Y EUR swaps as the basis, this is based over the last 2 years and has a very good tracking ability. This is the easiest tradable equivalent so convergent trades are easy.


Still a very simple model and of course it will be very related, it has both a component of interest rate differentials and EURUSD spot values.

_________________________________________________________________________________

Next - this next one is a composite of the first model, but it incorporates 1 month 25Delta risk reversals, i.e. the skew in the volaitilty between the 25D puts and calls for the one month expiration. A pretty generic indicator of position sentiment and probability of upside/downside.


_______________________________________________________________________________

Next - this one shows the expected 1 year rolling 3M libor differential between US and EURs, basically a derivative of the speed of rate changes between the two, as it stands the rate differential is pretty much 0bps modelled to about 1.32 on the EURUSD. when considering the Dec 2015 contracts though, the interest rate diff is close to 30 bps, but will more likely trade around the June wides of 70-80bps once tapering occurs (especially after ECB rate cut) and as such, once interpolated with current 1 year spread models, the EUR is expected to be trading at ~ 1.26, then in 2015 at 1.17.


This is broadly inline with consensus estimates for 1 Year EURUSD rates


Forecast for EURUSD, bbg
________________________________________________________________________________


finally - A very long term look at the EURUSD based on the 2005-08 hike period. This one follows well on the day-to-day moves but at a lower relative move. suggesting that in the long run the current variations in the interest rates have little fair value impact on the long term price. But considering the first - we know that they can be used for all time frames.


But because of the l/t nature the deviations are much greater from this fair value.

________________________________________________________________________________

GBPUSD model

Firstly - this one incorporates both Vol skews and interest rate differentials, much like the third one for EURUSD


This YTD model is my main for the GBP, and so far there haven't been any major divergences which is good for the model - bad for trading.
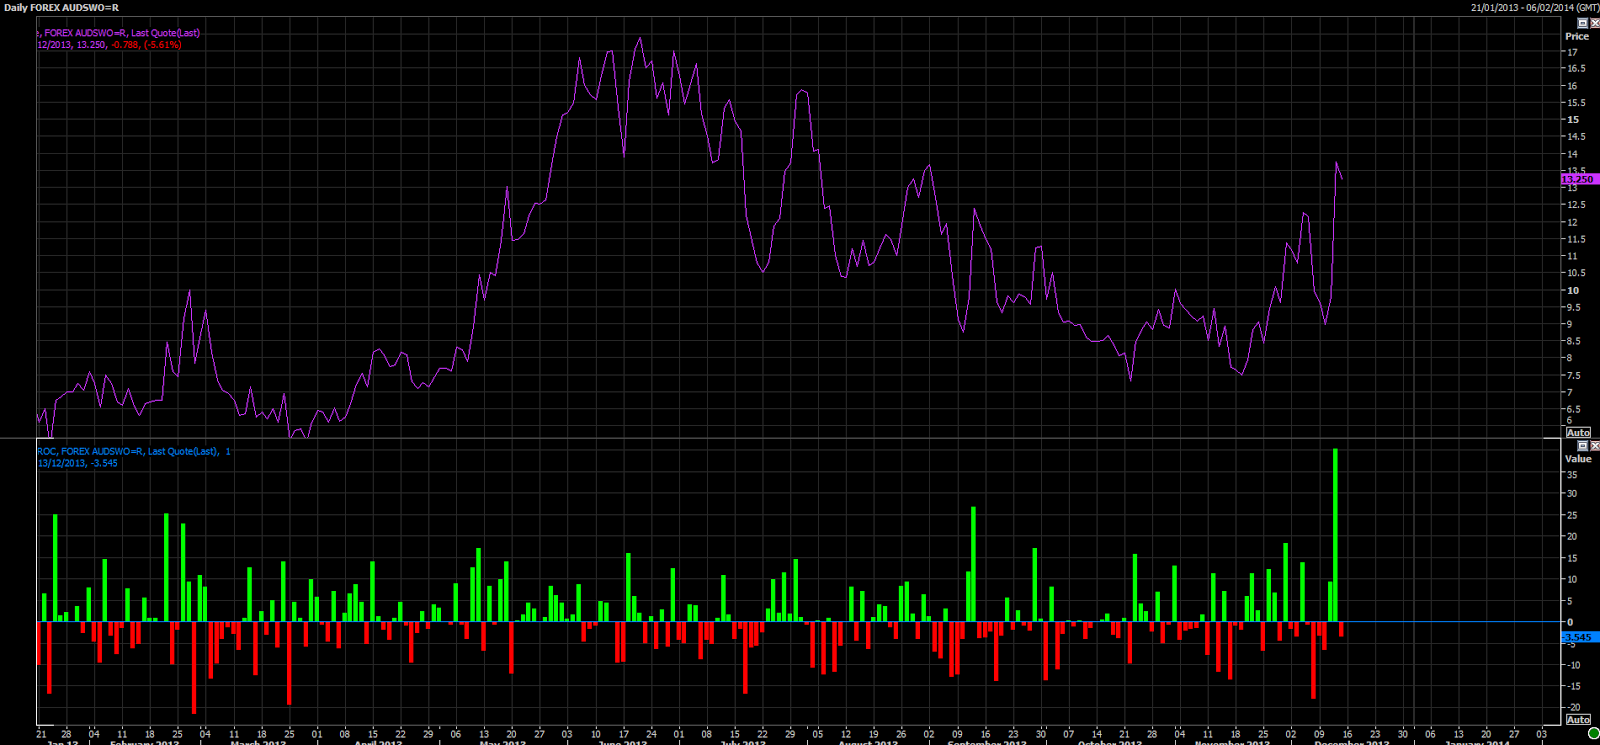
_________________________________________________________________________________

AUDUSD model

This one is far more interesting, the AUDUSD is very sensitive to interest rate differentials, but on the 5yr duration. More on this here

- https://www.dropbox.com/s/hzpoo212ed5q9uu/SG%2520AUD%5B1%5D.pdf

But also, the value of commodities is key, most notably copper. And so I've incorporated both of these into this model and this is the most peculiar of all the models.


this is a longer term model shown over this year and there have been some amazing risk adjusted returns. And as it stands there is a 500 pip deviation in fair value, and considering how easy copper is to trade there is real potential here.

Either way, this is just a few charts quickly put up to show how my models are fairing at the moment, but I'm always adjusting them so they do change.


Thursday 7 November 2013

Where is fair value?

Well after the ECB rate cut today, I thought I would look at some regressions for the relationship between spot FX rates and respective interest rate differentials

I'll first look at the AUDUSD and will follow the same steps for each FX pair, Firstly here is a chart comparing the AU-US 5 year yield spread to the AUDUSD on an almost YTD look

AUDUSD vs AU5US5 spread
Using this data, when we run it through a regression calculation we see a value of 78% for the R^2, high enough from this one variable correlation to consider useful enough in making a model from it. As such I plotted the respective values and came out with a linear regression which follows the expected idea that higher Interest rate differential (in bps) correlates with a higher AUD


AUDUSD vs AU-US 5yr spread (bps)

Using this R^2 value  we can create a model and below we can see the spread between the interest rate model and the AUDUSD spot price.

Currently, as seen, the spread stands at around 500 pips, or in other words, the AUDUSD is undervalued by 500 pips to its interest rate model (based only on 5 years spreads). In an ideal world we would position ourselves with a mindset to be in a 5yr tightening trade, while also being in a Long AUDUSD trade - if weighted properly then the trade will be hedged and P/L will be defined by the path of the model below.


Now considering other pairs, I'm going to look at the EURUSD vs the 2 year rate differential we get R^2 of merely 54%, however the price feed has a one month break in data which puts of this value, but the divergence is often so small its not noticeable. However if the 2 year rate spread moves to 25bps the model forecasts a rate of 1.285 for the EUR +/- 150 pips as the fair value level. This is currently far below spot market and as such the EUR potentially could fall very far if short term bund yields drop more.

EURUSD vs US-DE 2 year spread (bps)

But throughout the period of the model the divergence has moved much further than 100-150 pips from fair value, but currently the EUR is overvalued by around 350 pips to current fair value (which could drop more after ECB cut)

For the GBP, a view that if rate differentials on the 2 year (currently at 10bps) dropped to 0, then the implied fair value would be 1.5252 with a range based on the standard deviation of the model divergence of 1.55-1.500. With the recent tendency of Mean reversion between UK and US rates this is a distinct possibility until Carney backs down somewhat on Fwd guidance, then the mkt expects UK interest rates to race away from US (by race, like 50bps but yeah) and using the current model would see 1.7230 (but the model changes every day based on price changes so it would be dynamic)

Either way, Interest rates are key in pricing FX rates and as such need to be considered at all times, Above calculations have used relatively recent data but the ideal still holds true.

Friday 1 November 2013

Market update - ECB in view

If you've followed me for a while on twitter or my daily webinars, it will be no surprise that the ECB could cut rates soon, In fact I've been calling for it since the end of the Summer. But all of a sudden the market finally woke up to the fact the ECB need to do something. Even though 25 bps won't do much to inflation / expectations / growth / unemployment, it will show that the ECB are ready and willing to act to prop up the EZ.

In terms of the options market this drop in the EURUSD was seen by the sharp widening of the 25 delta risk reversal from -0.15 to -0.4 in a short time. The EUR them precedded to drop and the 25d RR stand at -0.788 now.

EUR1MRR (white), EURUSD (purple), EUR 1 week vol - 1 month vol (green)

furthermore a term structure view suggests the market is positioning itself for volatility ahead of the ECB meeting on Nov 7th, and now 1 week vol is 1.6 points higher than 1 month.

These ideas can all be shown together in the Vol surface below


We can see the higher implied volatility in the 1 week than up to 6 months, but in the very short term the 25d risk reversal is small, only getting bigger with time

Today, the expectations of intervention from the ECB grew as credit risk and premiums tightened somwhat across Club Med credit markets.


Here we can see Italian, Spanish and then Portuguese 5y CDS mid spreads today, all down around 10-15 bps on the day.

This came at the same time as Spanish 10 Yrs have dropped to 4%, testing their post crisis lows, and Greek 10 years down to ~8%. Now up 403% in price (ex. coupons) since the Q2 2012 low.

Overall, it would have to seem like the credit markets now expect to see some sort of dovishness from the ECB next week. This comes at a time that the CitiFX economic surprise index for the EZ drops to negative territory


As Barclays FX puts it

"Any month end demand for EURUSD was obliterated by a wall of EURxxx supply as the deflationary issues rear their head and people start to think more seriously about ECB action later on this year or at the start of 2014. Nowotny kicked things off in Asia talking about liquidity provision and EURUSD was lower as stops were triggered down to 1.3688. Swathes of EURGBP and EURCAD supply from spec names kept the headline pair very much under pressure "

The idea that a lot of the move came through the Crosses is seen here through a heatmap of FX volume as seen on the Reuters dealing platform (2nd largest by volume in the world)


All in all, I'd put the chance of a 25bps cut next week at about 30%, with a 50% chance in Dec and then 20% not at all (as per Goldman)

But even though the EUR has dropped, there is still a long way to go to meet 2 year yield differentials

EUR (blue) vs. US/DE 2 year yield spread (green)
- UBS: Now expect 25bp refi rate cut and a 50bp marginal lending rate cut at Nov meeting.
- BAML: Believe ECB will cut refi rate by 25bp next week, but will refrain from cutting the deposit rate. Inflation likely to remain at low levels, therefore no need for ECB to move after next week's cut.
- BNP: Now expect a refi rate cut of 25bp before year-end.
- JPM: Now expect 25bp refi rate cut in December. - RBC: Do not look for ECB to lower rates in the near term.
- Barclays: ECB to remain on hold. Wait for inflation forecasts at Dec meeting.
- CS: Should leave door open for possible rate cut in Dec when 2014/15 inflation forecasts are announced.
- RBS: Now expect 25bp refi rate cut in November, with a 50bp cut in marginal lending rate, while deposit rate remains unchanged.

Tuesday 22 October 2013

NFP day

NFP Friday Tuesday was today, we saw a print of 148k on estimates of 18k, nowhere near good enough (~200k) change needed to spur on tapering at the moment. On the plus side the Unemployment rate dropped to 7.2% but the headline Sep NFP number was the key, and that came in weak.

The reaction across the markets was entirely predictable, stocks traded higher, bonds traded higher and the USD got slammed across the board.

But, soon after the reading, cross asset correlations started to break down considerably. One of the key determinants of the USDJPY pair is the Interest rate differential between UST's and JGB's. As JGBs are shut, USTs drive the USDJPY price action through the US session.

we can see here the clear divergence post-NFP and we can see my tweet suggesting shorting USDJPY and hedging short USTs


We can see the USDJPY is purple and the US 10 year futures contract (ZN_F) inverted to represent yield, the correlation is normally clear but the divergence was shocking to me.

So as tweeted so shorting both (when weighted properly) would result in a tidy convergence trade, resulting in a 0.3% return, but the advantage here is that this was well hedged against market volatility and represented a great risk-adjusted return.

I suppose the moral here is to follow me on twitter for more simple trades like this :)

Tuesday 15 October 2013

Trade updates

So my outstanding trades are as followed

Short GBP at 1.6190

Short EUR at 1.3595

Long US-DE 2 yr spread

As of today I've covered the Short GBP to mitigate too much USD risk. And while I'm bearish still, I think taking some off here is decent.


covering at about 1.5920 (horizontal fib level / triple bottom support) resulting in a trade profit of 270 pip profit.

The second trade can be seen here


Entering a "long" spread trade at -0.38 with it now trading at close to -0.25 is working very well, so is the EURUSD which is up about 100 pips currently. And looks like it could go much lower given the right circumstances from Washington

Tuesday 8 October 2013

Market update 8th October 2013

So today was interesting, at least on the very short end of the yield curve, 1-month T-Bills rocketed as high as as 0.355%, while many are saying this is a rather insignificant move (and it kinda is) it shows how quickly the front end can move, the 1 month benchmark has been stuck to 0% since 2009, and barely budged throughout the European Crisis (ofc) and were only a little weaker during the "fiscal cliff" so in contrast it is quite big.

MTD US 1 month Benchmark yield. Reuters

Notably, the front end of the curve inverted up until about 1Y 9M (the 2yr-1m reached 2bps at one point though!)

US yield curve - Tradeweb

Here we can see the bills yields, the benchmark was up 17bps when this screenshot was taken

UST bills Quote screen. Bloomberg

Furthermore, for the first time, the yield on the US 1 month was > than the 1 Month LIBOR

US 1M TED spread


But these moves higher in US interest rates should be impacting the USD after all interest rate differentials have widened and the 2 Year Soverign spread has moved to 20bps from 12 or so a few days ago. To consider this, the last time the 2 yr spread was at 20 bps the EURUSD traded at 1.3150

EURUSD vs US-DE 2 YR spread

Divergences like this don't tend to last long, and either the US yield is going to drop suddenly(tightening the spread), or the EURUSD is going to drop. Hard.

So here is another look but considering the 2 Yr futures so we can see trade potential

EURUSD vs Bond futures

So here we have the US 2 YR futures contract and the German Schatz future (2yr ish) nominal spread overlayed in green. below we can see a visual representation of the spread by having them overlayed on the same axis.

At a current nominal spread of 0.38 points we are looking to buy US 2's and Short DE 2's. This sythetically puts us "long" the green line.

Simultaneously by shorting the EURUSD we would be hedged against interest rate risk and we would then need to wait for them to converge.

In terms of my weighting I haven't made it a perfect hedge as I have a personal downside bias in the EURUSD. So lets consider how to enter this trade.

Long  1000 TUc1 (US 2 YR) at 110.015

Short 1000 FGBSc1 (DE 2yr) at 110.395

Short EURUSD 1.3595 (Yellen just hit the wires)

Positioned like this, a tightening to 0.20 points would result in profit ~ £201.71 (at GBPUSD 1.6083 and EURGBP 0.8438) , at 0.30 points it would be £128.21

Now we need to consider the EURUSD position at this point a €10,000 notional short from mkt (#spot ref 1.3570) , yielding $1 (0.62.2p) per pip would result in a profit of $300 (~£190) if/when the EURUSD dropped to 1.3295.

If the trade worked perfectly then I believe as opposed to a simple meet-in-the-middle idea the EURUSD drops to catch up with yields then the rough area of conjoining would be ~ 1.327 or 0.30 points at this scale. 

Resulting in a profit or £390 or so depending on GBPUSD fx rate. This is a simple look using 1 contract in the future and a 10k short in the EURUSD but can easily be scaled up and adjusted depending on bias.

Worst case, the spread between the EUR and the 2Yr sov spread widens. 

Roughly speaking if it widens to 0.5 points then the potential loss is ~£150 although this would imply a EURUSD of 1.2970, the EURUSD needs to be below 1.3345 for the trade to BE, so it can be seen that I've quite substantially weighted towards the EURUSD as opposed to the spread.